Screener
The Screener filters the company universe by fundamental criteria. Build a screen from any number of criteria, save it, and reopen it later.
How it works
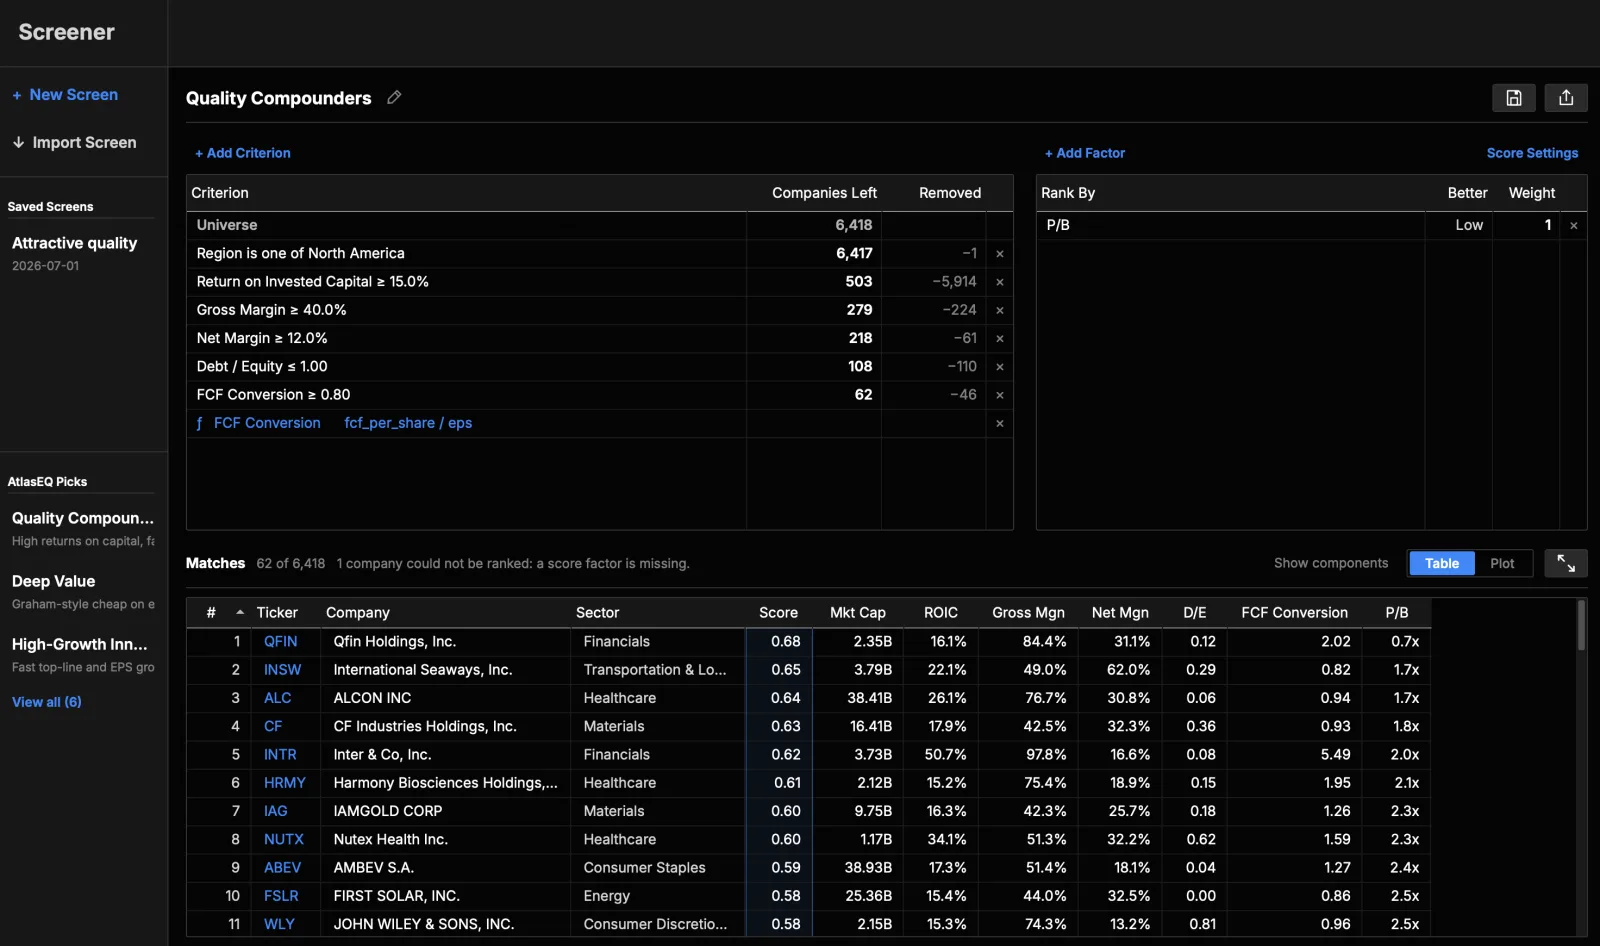
- Live results: results update as you add or change criteria. There is no separate "run" step.
- Stacked filters: each criterion narrows the set further. A waterfall display shows how many companies survive each step.
- Results are sorted by market cap and capped for speed.
Criteria
Criteria are organized into groups:
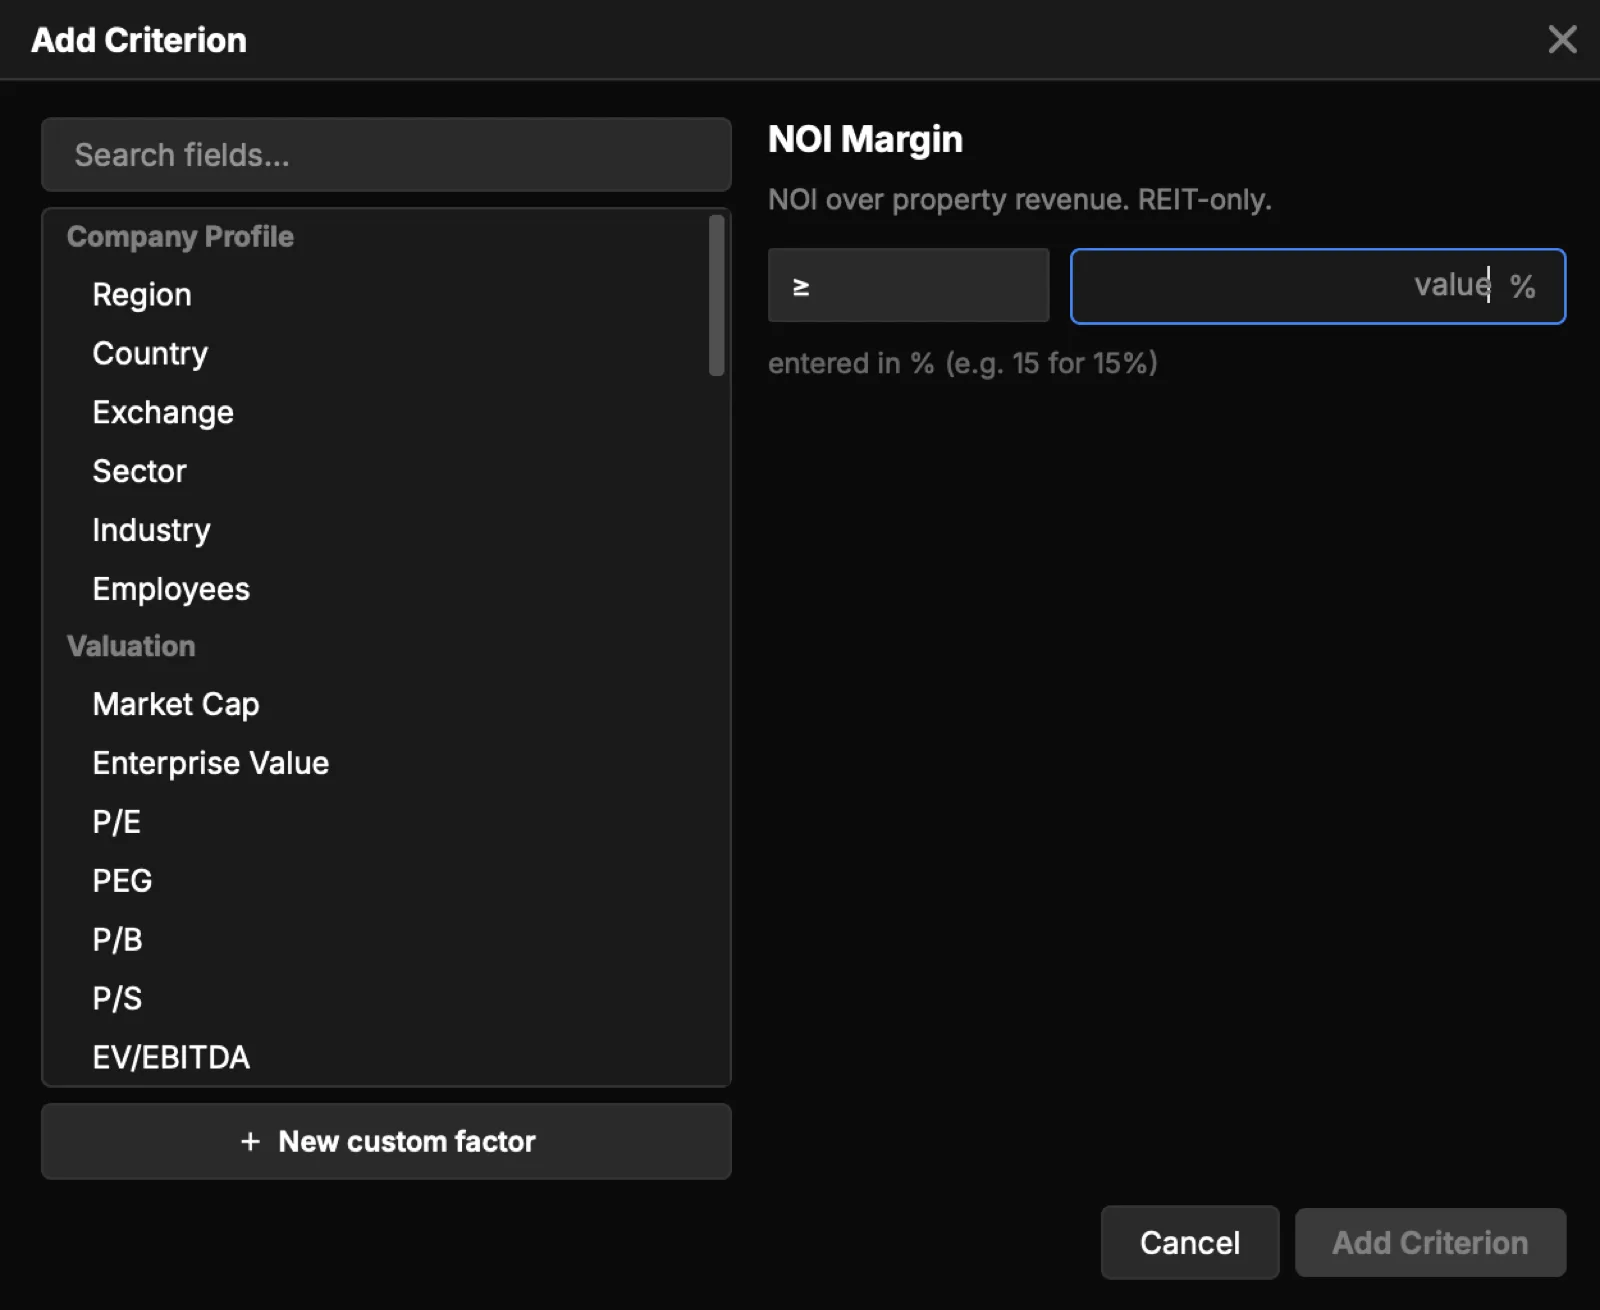
- Company profile: region, country, exchange, sector, industry, employees.
- Valuation: market cap, enterprise value, P/E, PEG, P/B, P/S, EV/EBITDA, EV/Revenue, dividend yield, and more.
- Margins: gross, EBITDA, operating, and net margin.
- Returns: ROE, ROA, ROIC, ROCE, asset turnover, and related measures.
- Growth: revenue, EBITDA, and EPS growth (year-over-year and 3-year), net income growth (year-over-year), and 5-year dividend growth.
- Leverage: debt/equity, debt/assets, net debt, net debt/EBITDA.
- Liquidity: current, quick, and cash ratios.
- Coverage: interest coverage.
- Efficiency: receivables, inventory, and payables days, and the cash conversion cycle.
- Per share: EPS, book value, dividends, free cash flow per share, payout ratio.
- Real estate (REIT): NOI, FFO, and related measures.
For numeric criteria you set an operator (≥, ≤, >, <, =, or a range). For categorical fields you pick from a list of values.
Plot
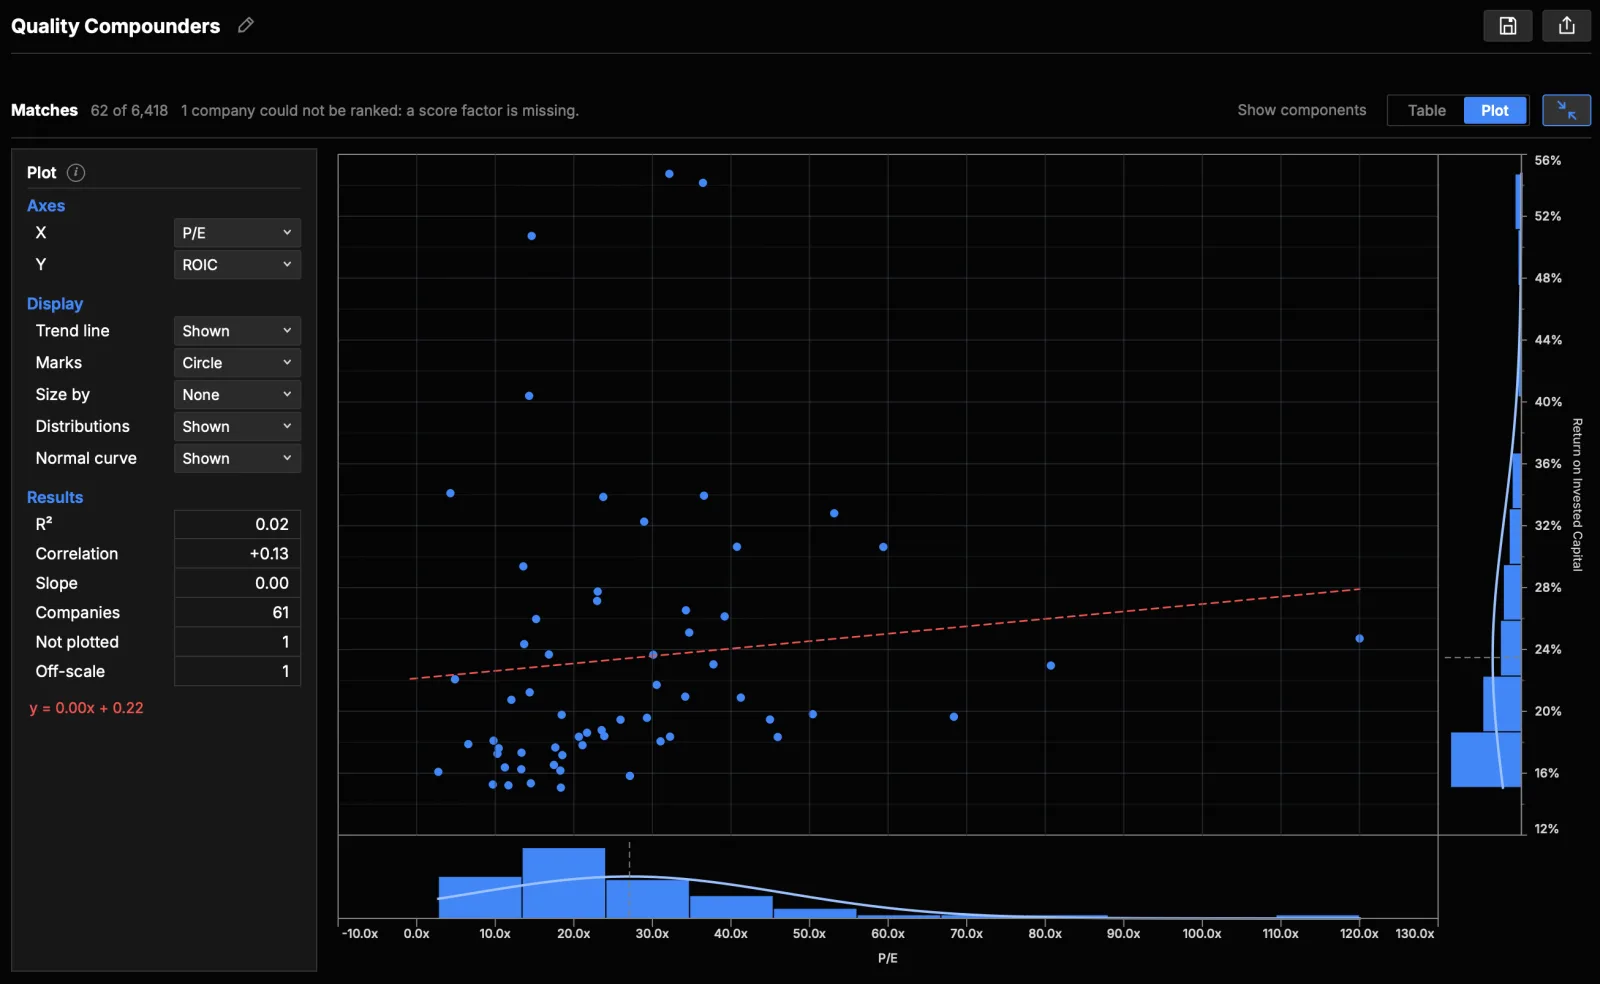
Switch the results from Table to Plot to see the same matches as a scatter chart. Pick any two numeric fields for the X and Y axes, and set the trend line, mark style, point sizing, and the distribution and normal curves along each edge. The panel reports R², correlation, slope, and the fitted line, along with how many companies were plotted, not plotted, or off-scale.
Custom criteria
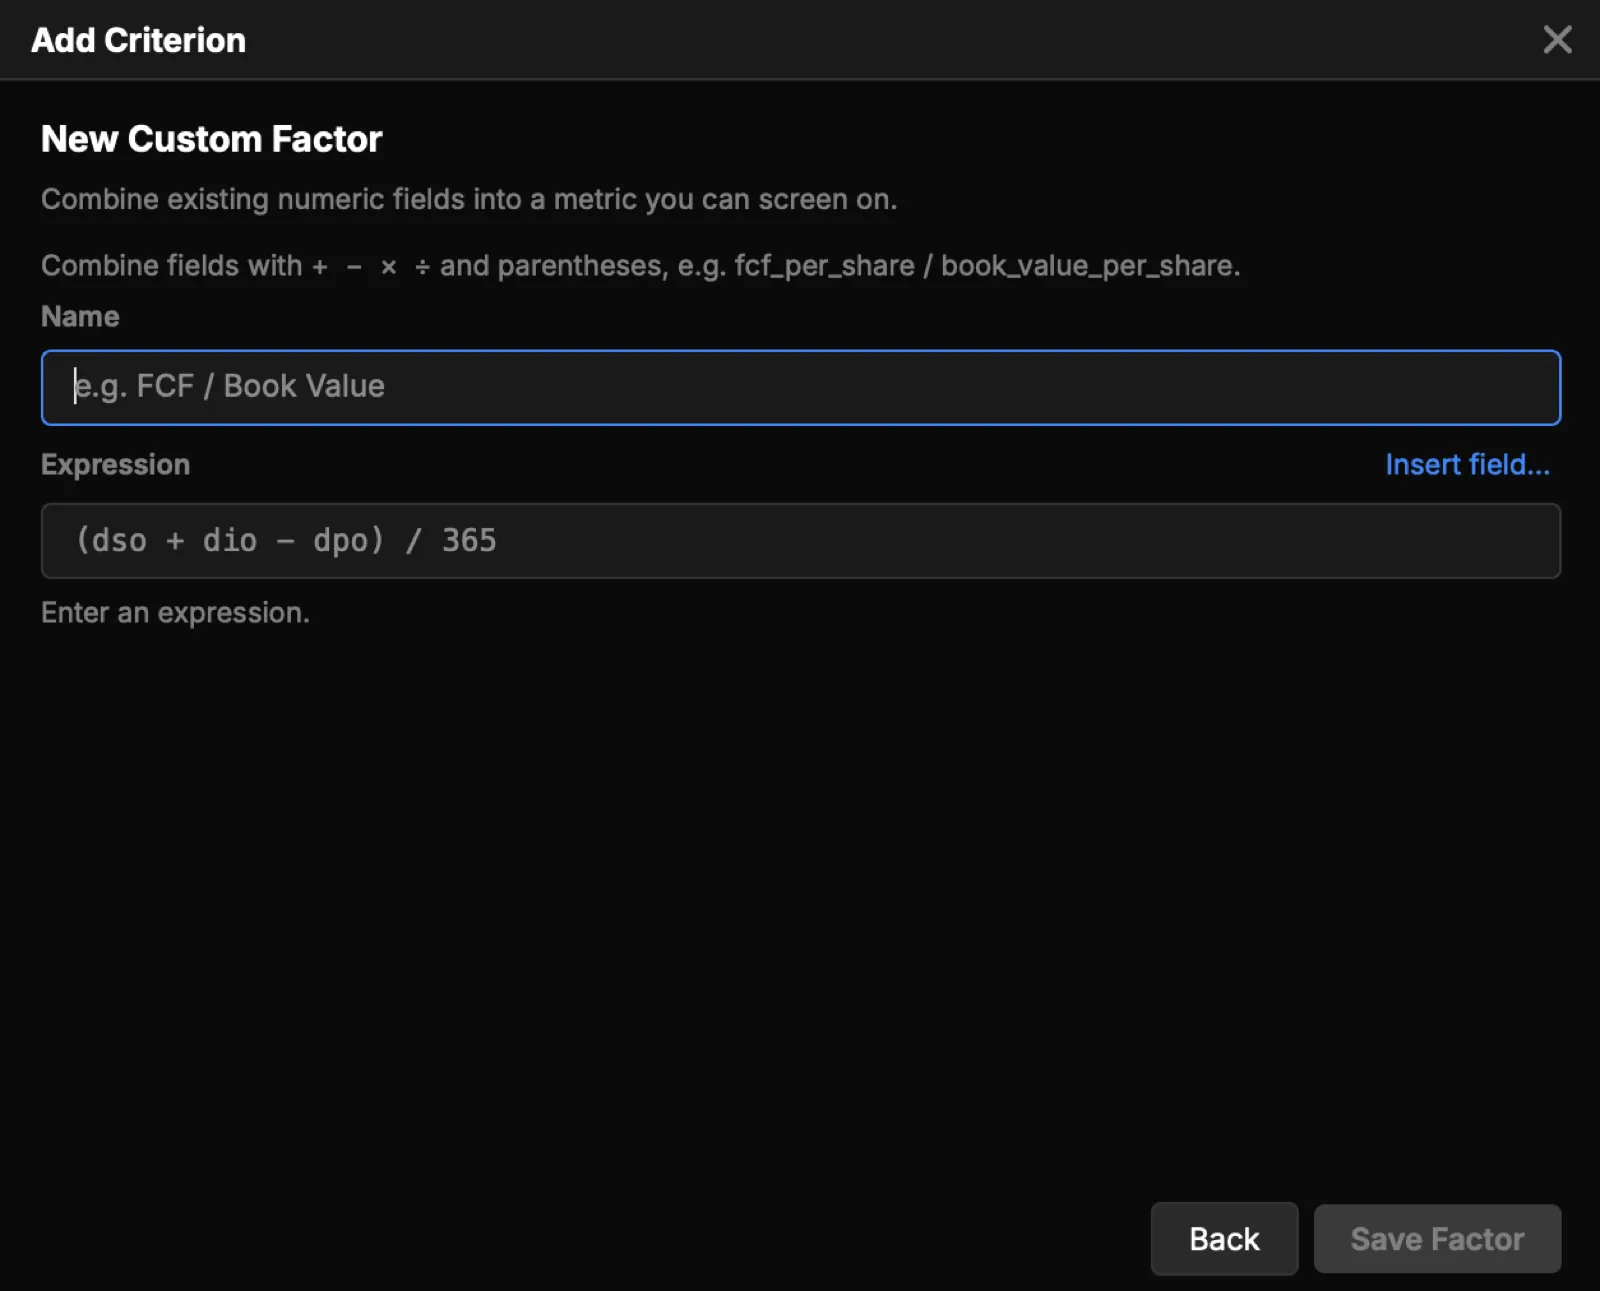
Build your own calculated metric as an expression that combines existing fields, for example free cash flow divided by book value. Once created, you can filter and sort on it like any built-in metric.
Ranking factors
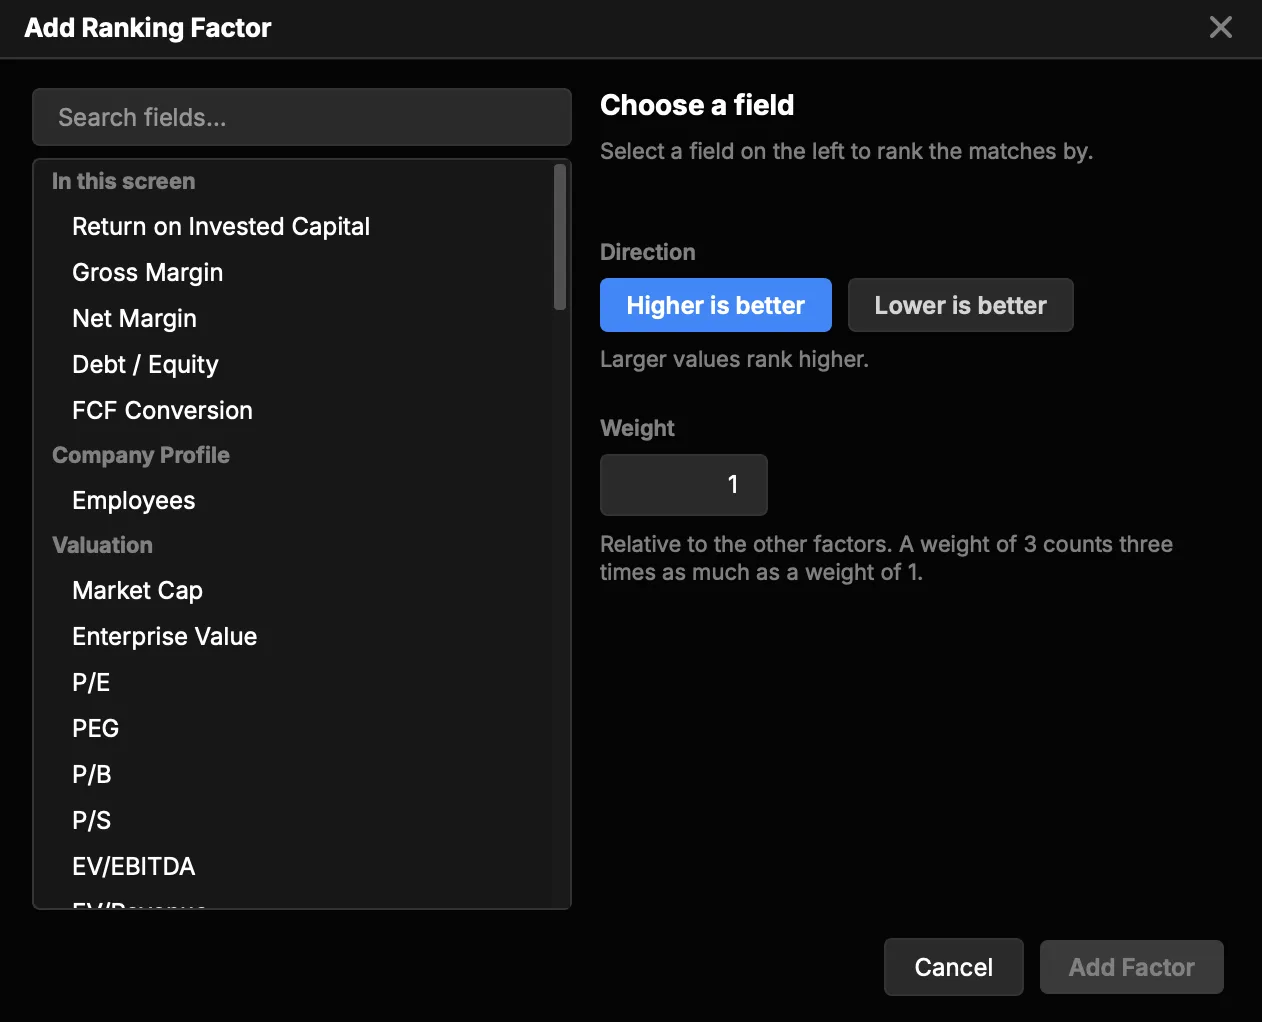
Criteria decide which companies match; ranking factors decide the order they come back in. Add a factor from any field in the screen or the wider library, choose whether higher or lower is better, and give it a weight relative to the other factors. Stack several and the matches are ranked on their combined score. A company missing one of the factors cannot be ranked, and the results panel says so.
Saving, sharing, and exporting
- Save: name and store screens. Saved screens sync to your account across machines.
- AtlasEQ Picks: a library of ready-made screens from the AtlasEQ team. Open one as a draft and save your own copy.
- Share: send a screen as a live definition or a point-in-time snapshot. Paste a shared link to import and run it.
- Export: download results to Excel, including a summary of the criteria you applied.
Results
The results table lists matching companies with their name, sector, market cap, and a column for each numeric criterion and custom criterion. Expand the results to hide the criteria panel and show more rows.