Ratios
The Ratios view collects a company's financial health, valuation, and efficiency metrics on one screen. Unless noted, ratios are based on the Trailing Twelve Months (TTM) — the last four reported quarters summed into a rolling year. Rows that can only be measured over a full fiscal year carry a small LFY (Last Fiscal Year) tag next to their name. The fiscal year-end and latest quarter are shown at the top.
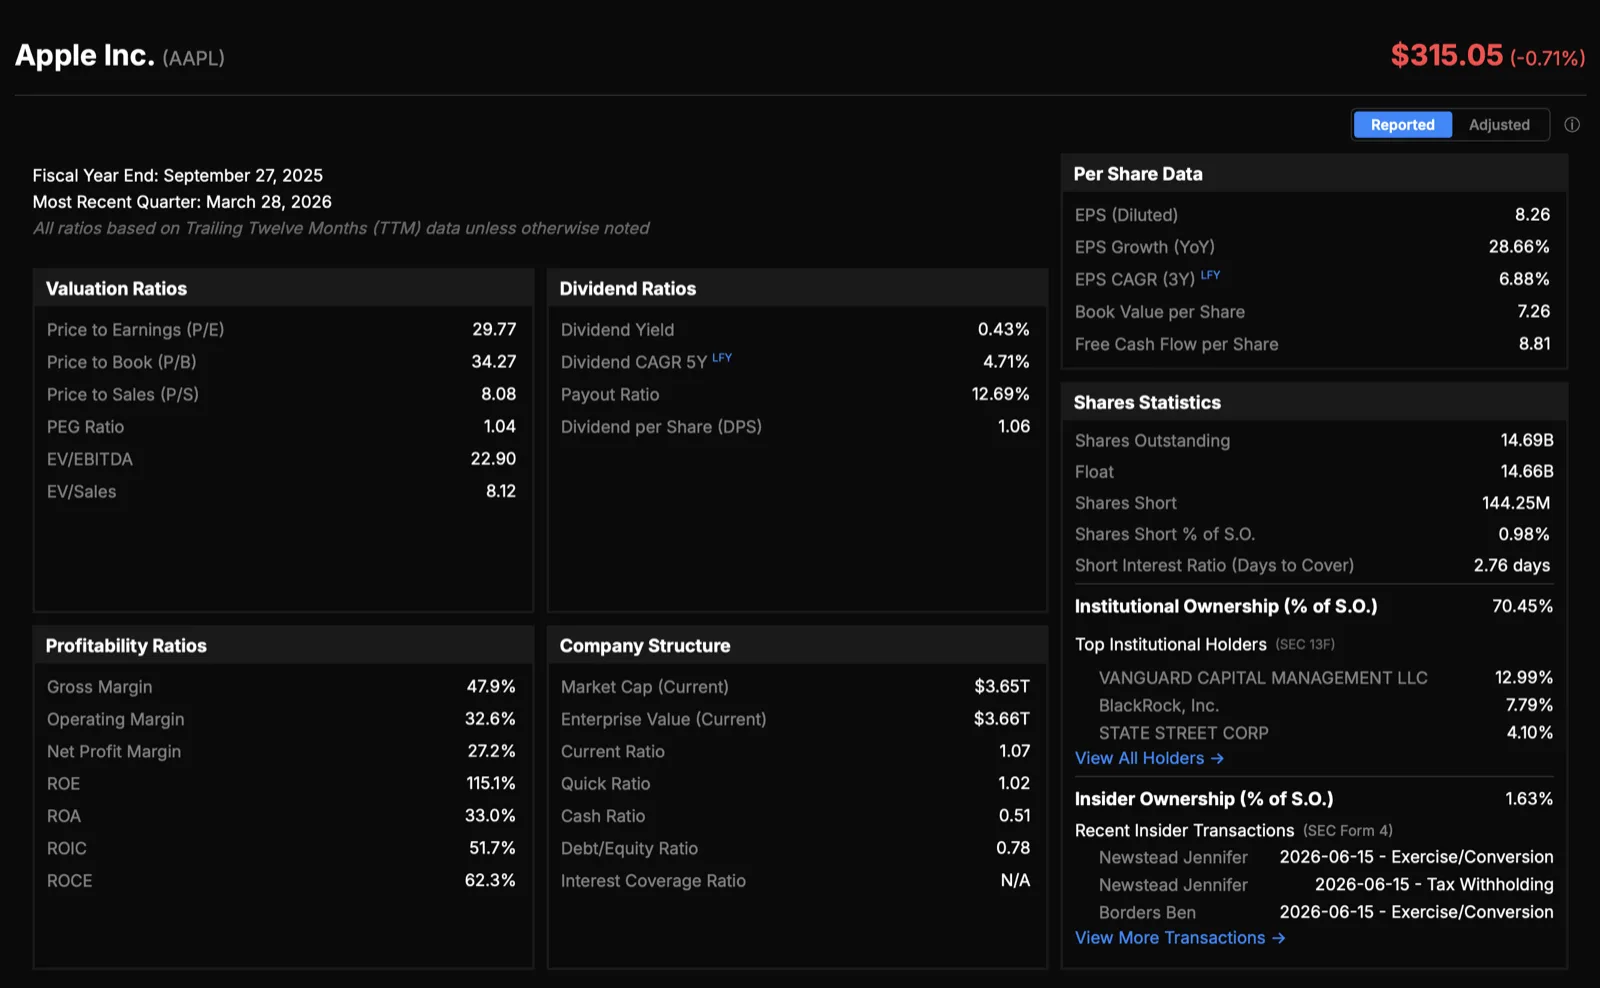
What you'll see
Ratios are grouped into sections:
- Valuation & price: P/E, Price/Book, Price/Sales, EV/EBITDA, EV/Revenue, dividend yield.
- Per-share: EPS, book value per share, free cash flow per share, dividend rate.
- Profitability margins: gross, operating, and net margin.
- Returns on capital: ROE, ROA, ROIC, ROCE.
- Liquidity: current, quick, and cash ratios.
- Leverage & coverage: debt/equity and interest coverage.
- Shares & ownership: shares outstanding, float, insider ownership, top institutional holders, and recent insider transactions.
The rows shown depend on the type of company. REIT-specific rows such as FFO measures appear for real estate companies, and metrics that don't apply to banks or insurers are hidden.
Reading each group
Valuation & price
These ratios compare the market's price against a fundamental figure, so they tell you how much you pay for a unit of earnings, book value, sales, or cash flow.
- P/E: price divided by earnings per share. The most common gauge of how richly a company is valued relative to its net profit. It is sensitive to capital structure and tax, and it breaks down when earnings are near zero or negative.
- EV/EBITDA: enterprise value against earnings before interest, tax, depreciation, and amortization. Because enterprise value includes debt and EBITDA sits above interest and tax, this multiple compares companies with different debt loads and tax situations on a more even footing than P/E. It is often preferred for capital-intensive businesses and for comparing across peers.
- EV/Revenue: enterprise value against sales. Useful when earnings are thin, volatile, or negative, since revenue is more stable than profit.
- Price/Book: price against net asset value. Most meaningful for asset-heavy or financial companies where book value is a fair proxy for the equity base.
- Price/Sales: price against revenue per share. A rough valuation anchor that works when margins are depressed or in transition.
- Dividend yield: dividend per share against price. The cash return a holder receives at the current price, before any share-price change.
Note
A high multiple is not automatically expensive and a low one is not automatically cheap. Multiples reflect expected growth, risk, and returns on capital, so read valuation next to the profitability and returns groups rather than in isolation.
Per-share
These express fundamentals on a single-share basis, which lets you line them up against the share price. EPS is the profitability anchor behind P/E. Book value per share underlies Price/Book. Free cash flow per share shows the cash the business generates for each share after reinvestment, which can diverge from EPS when accounting earnings and cash flow move apart. Dividend rate is the cash paid per share.
Profitability margins
Margins measure how much of each sales dollar survives at three points down the income statement.
- Gross margin: revenue less cost of goods sold, as a share of revenue. It captures pricing power and direct production cost.
- Operating margin: operating profit as a share of revenue, after operating costs but before interest and tax. It reflects the core business before financing and tax choices.
- Net margin: net profit as a share of revenue, after everything. It is what flows through to owners.
Reading the three together shows where profit is won or lost. A healthy gross margin that thins out by the operating line points to heavy overhead or operating spend; a solid operating margin that shrinks by the net line points to interest or tax drag.
Returns on capital
Where margins measure profit per sales dollar, these measure profit per dollar of capital, so they show how well the company invests.
- ROE: return on equity, net income against shareholders' equity. The return to owners, but it rises with leverage, so a high ROE can reflect debt as much as operating skill.
- ROA: return on assets, profit against the whole asset base. It strips out the leverage effect that flatters ROE.
- ROIC: return on invested capital, operating profit after tax against the debt and equity actually invested in the business. Comparing ROIC against the company's cost of capital shows whether growth creates or destroys value.
- ROCE: return on capital employed, operating profit against total capital employed. Like ROIC, it is pre-financing, which makes it useful for comparing the operating returns of companies with different debt levels.
ROIC and ROCE matter alongside ROE because they judge the business before its financing decisions. A company can lift ROE with leverage while its return on the underlying capital stays flat or falls, and the pre-financing measures are what reveal that.
Liquidity
Liquidity ratios test whether the company can meet short-term obligations from short-term resources. They differ only in how strict they are about what counts as available.
- Current ratio: current assets against current liabilities. The broadest test, counting inventory and all other current assets.
- Quick ratio: the same idea but excluding inventory, since inventory can be slow or costly to convert to cash. A useful check where stock is a large part of current assets.
- Cash ratio: the strictest test, counting only cash and near-cash against current liabilities.
Reading them together shows how much of a company's short-term coverage depends on selling inventory or collecting receivables versus cash already in hand.
Leverage & coverage
- Debt/equity: total debt against shareholders' equity. It sizes how much of the capital structure is borrowed. Higher leverage lifts returns in good years and deepens losses in bad ones, and the level that is reasonable varies by industry.
- Interest coverage: operating profit against interest expense. It measures how many times over current earnings can pay the interest bill. A high figure signals comfortable headroom; a figure near 1 means earnings barely cover interest, leaving little cushion if profit falls or rates rise.
Read leverage and coverage together: a large debt load is easier to carry when coverage is high, and a modest debt load can still be risky if earnings are thin or volatile.
Shares & ownership
These describe the share base and who holds it. Shares outstanding and float frame the supply of stock, with float excluding closely held shares. Insider ownership and the top institutional holders show the ownership mix, and recent insider transactions show buying and selling by people close to the company.
What you can do
- Switch between Reported and Adjusted basis with the toolbar above the grid. The Adjusted basis shows an alternative, analyst-oriented view of returns and reveals a few additional rows; adjusted values are tagged with a small adj marker.
- Click View All Holders or View More Transactions to expand those lists.
Period basis: TTM and LFY
The figure behind a ratio depends on the period it is measured over, and the distinction matters most for income-statement and cash-flow inputs. There is no period selector — the basis is chosen automatically per row.
- Trailing twelve months (TTM): the default. The last four reported quarters summed into a rolling year, so the ratio stays current through the year instead of waiting for the next annual report, which helps for fast-moving businesses. When trailing data isn't yet available for a company, the view falls back to the Last Fiscal Year.
- Last Fiscal Year (LFY): the most recently completed full fiscal year. Rows that can only be measured annually are shown on this basis and carry a small LFY tag. It gives a clean, audited annual picture but can lag when a company is several months into a new year.
Balance-sheet ratios use the level at the period-end date, while income-statement and cash-flow ratios use the flow over the trailing period.
Note
Some figures (such as short-interest measures) refresh independently as their data arrives.