Peers
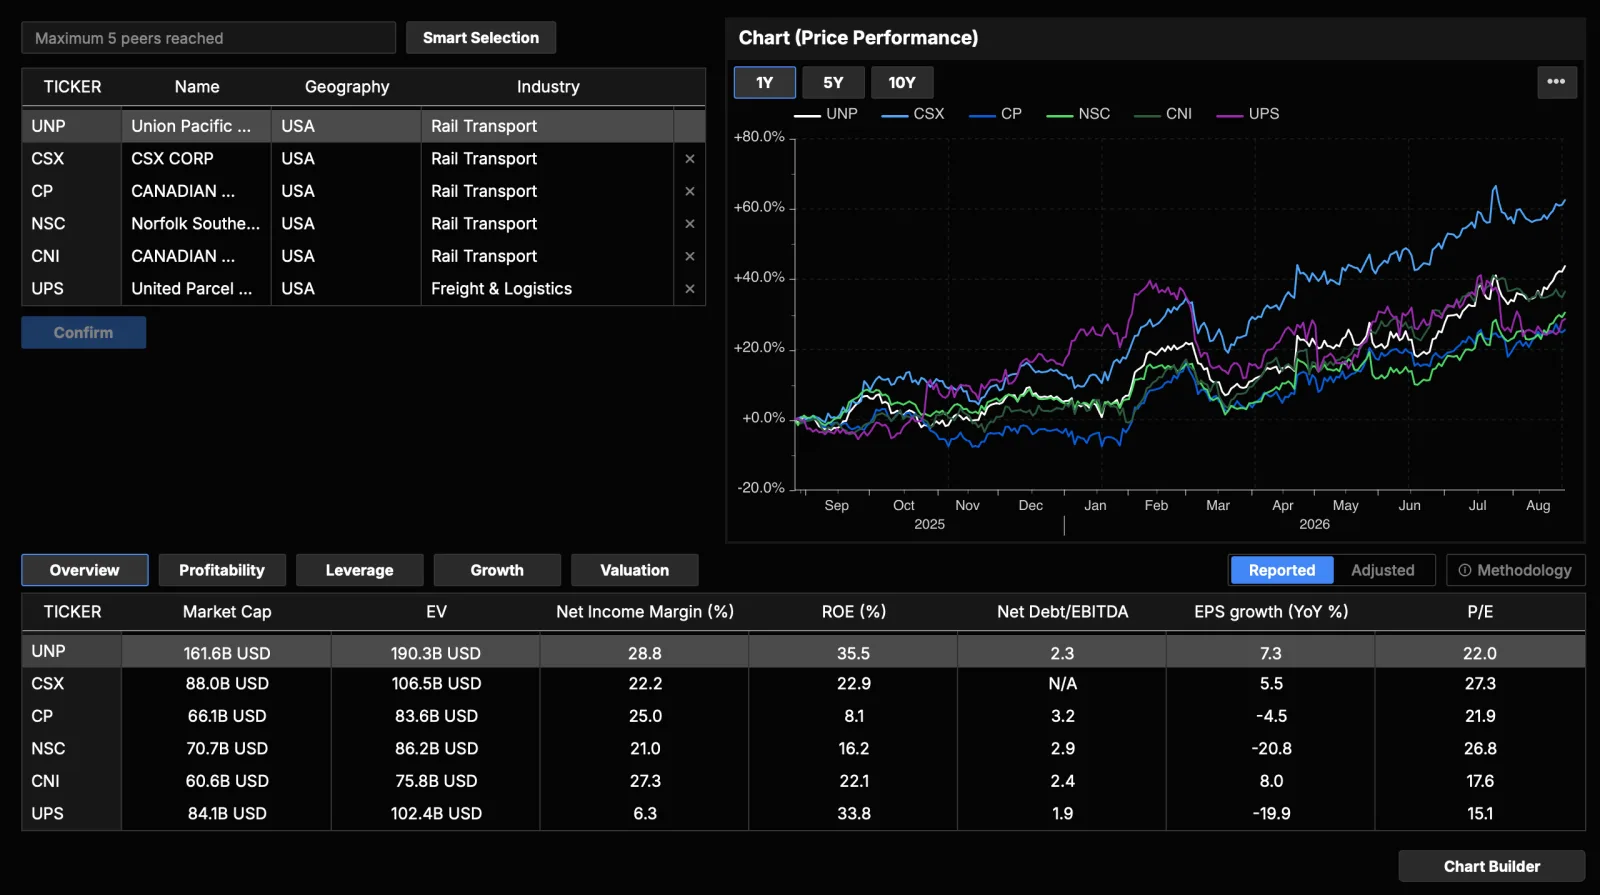
The Peers view compares a company against its industry peers across key metrics.
Why peer comparison matters
Almost every financial measure is relative. A price-to-earnings ratio of 25 is neither cheap nor expensive on its own; it only carries meaning next to the multiples of comparable companies. The same is true of margins, returns, and leverage: a 12% operating margin can be strong in one industry and weak in another. Peer comparison gives each number a reference point, so you can see whether a company is valued richly or modestly, runs more or less profitably than its rivals, and carries heavier or lighter debt. It also surfaces the questions worth asking. When a company sits far from its group on any measure, that gap is usually the start of the analysis rather than the end of it.
What you'll see
- A peer selection panel with a search box to add companies and a Smart Selection button that suggests industry peers for you.
- A comparison table with one row per company (the current company is highlighted) and columns of key metrics. Click any column header to sort, and remove a peer with the × button on its row.
- View tabs: switch the metric set between Overview, Profitability, Leverage, Growth, and Valuation. For real estate companies a Real Estate tab also appears.
What each metric view groups
Each tab regroups the same set of companies around a different question, so you can read one theme at a time instead of scanning a wide table.
- Overview: a broad snapshot that mixes size, valuation, and returns. Use it to get oriented and to confirm the group is sensible before you dig into a specific theme.
- Profitability: how much profit each company earns from its sales and its capital, through margins and return measures. Consistently higher profitability can point to pricing power, scale, or a cost advantage; a laggard here often has a structural reason worth understanding.
- Leverage: how much debt each company carries and how comfortably it covers its obligations, through leverage and coverage measures. Use it to judge financial risk and to check whether strong returns elsewhere are being helped along by heavy borrowing.
- Growth: how fast each company is expanding, through revenue, EBITDA, and earnings growth rates measured both year-over-year and over several years. It shows which names in the group are compounding fastest and which have stalled.
- Valuation: how the market prices each company relative to its fundamentals, through multiples such as price-to-earnings and enterprise-value ratios. This view tells you which names look expensive or cheap against the group, and it is where you look first when weighing whether a price is justified.
- Real Estate: REIT-specific measures such as NOI and FFO. This tab appears only for real estate companies and stays hidden for everyone else.
Building a good peer set
The comparison is only as useful as the group behind it. A well-chosen peer set holds the important things constant so that real differences stand out.
- Same industry and business model: click Smart Selection to pull peers drawn from the company's industry, then use the search box to add names that face the same customers, competitors, and economics. Companies with different revenue models rarely compare cleanly even inside one sector.
- Comparable size: very large and very small companies often differ in margin structure, funding, and growth in ways that have nothing to do with quality. Keeping the group within a reasonable size range makes the multiples and returns more directly comparable.
- Enough names, not too many: you can compare up to five peers, and a handful of close comparables usually reads more clearly than a longer list that drifts away from the original business. Add companies deliberately, then click Confirm to load their data.
What you can do
- Build your peer group: search for and select up to five companies (or use Smart Selection), then click Confirm to load their data. Remove a peer with the × button on its row.
- Switch metric views to focus on profitability, leverage, growth, or valuation.
- Sort by any column. Sorting ranks the whole group on one measure, which makes outliers obvious: the company at the top or bottom of a column is the one to explain, and the ordering shows where the current company falls within its peers.
- Switch between Reported and Adjusted basis. Reported figures follow the numbers as filed; Adjusted shows an alternative, analyst-oriented view for select return and coverage measures (such as ROE, ROIC, and interest coverage), which are tagged with a small adj marker.
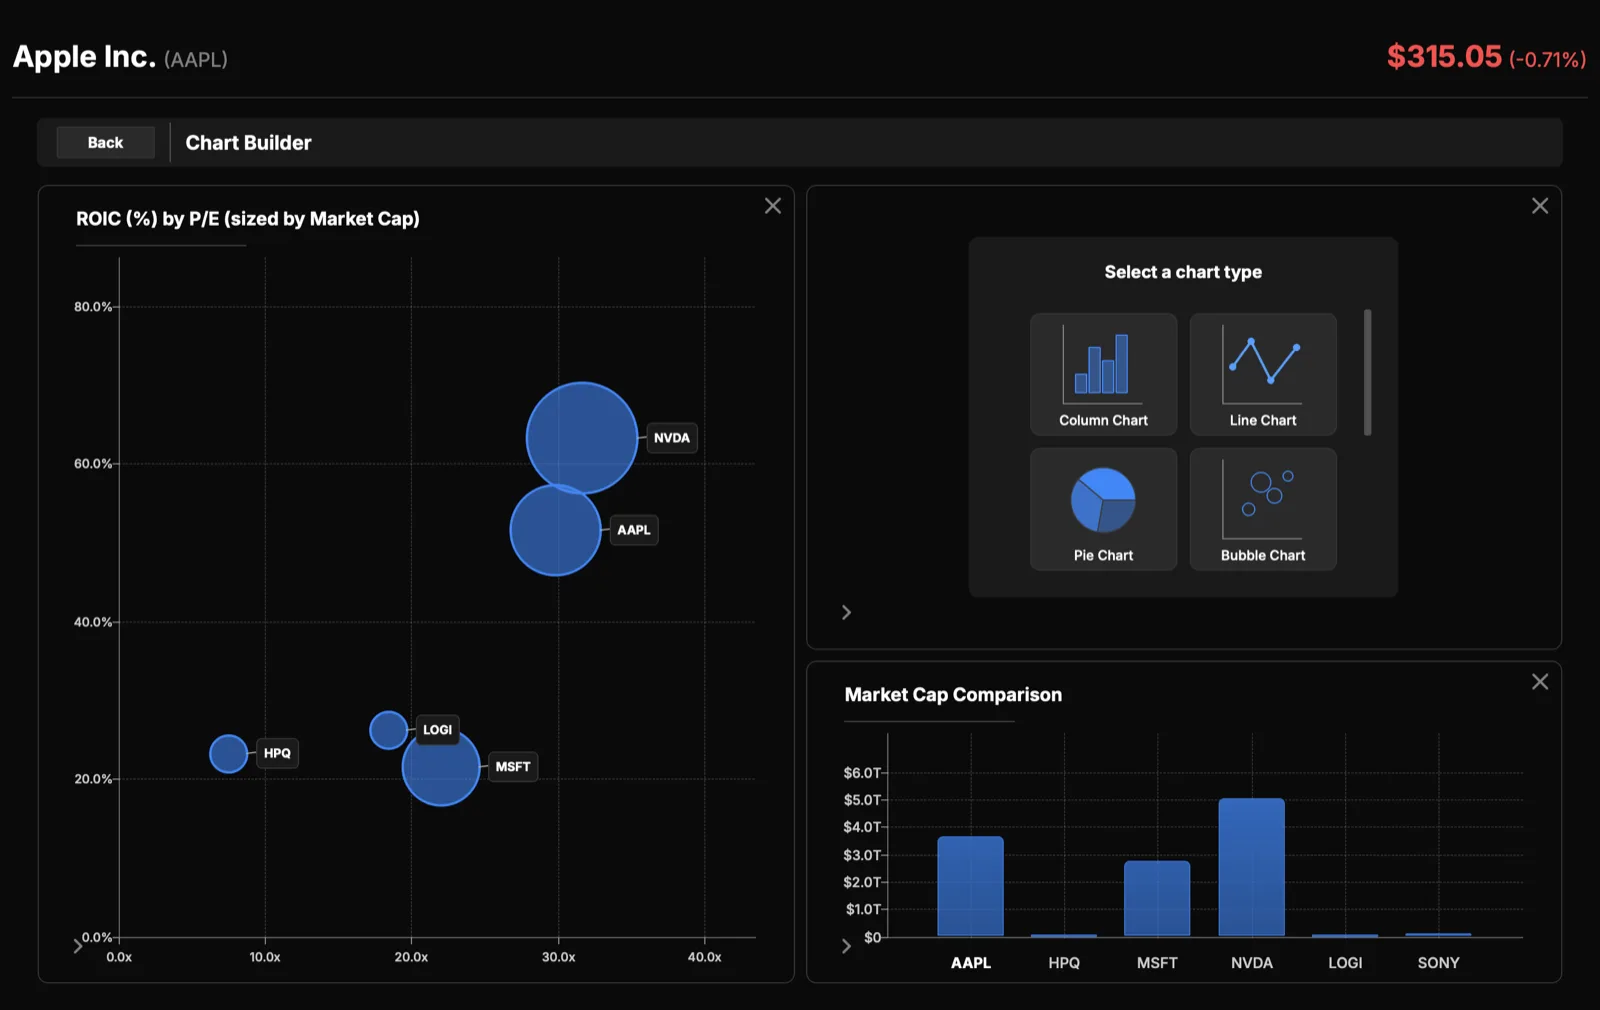
- Chart Builder: once peers are confirmed, open the chart builder to create custom comparison charts and export them as PNG, PDF, or Excel.
Note
Peer data loads company by company, so individual rows fill in as each company's figures arrive.