Valuation
The Valuation view holds several models for estimating what a company is worth. You set the assumptions and each model returns an implied value you can compare against the current price. Each model approaches the same question from a different angle, so reading them together gives you a fuller picture than any single number.
Models
Discounted Cash Flow (DCF)
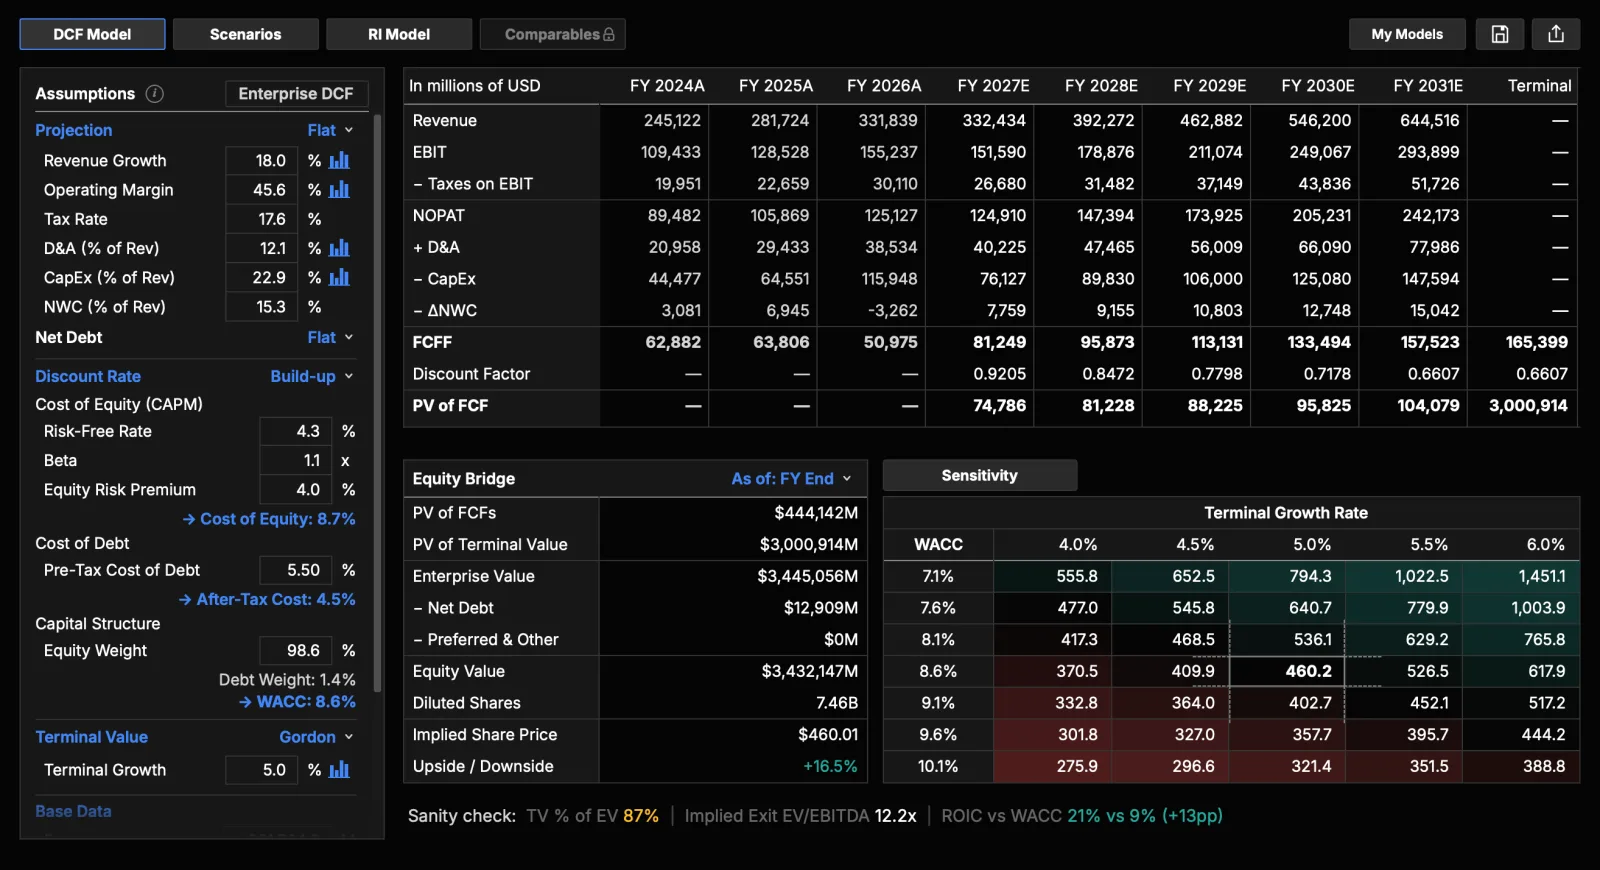
A DCF estimates value from the cash a business is expected to generate in the future, discounted back to what that cash is worth today. Free cash flow is the cash left after a company pays its operating costs and funds the investment needed to keep running and growing. A firm-level DCF projects free cash flow to the firm, the cash available to all providers of capital before financing, and discounts it at the weighted average cost of capital. An equity-level DCF projects free cash flow to equity, the cash left for shareholders after debt is served, and discounts it at the cost of equity.
You set the assumptions behind the forecast — the growth applied over the five-year projection, the terminal growth rate, and the discount rate (WACC) — and each edit updates the result live. WACC represents the blended return that debt and equity investors require to hold the company's capital, so it is the rate at which future cash is converted into present value. A higher discount rate lowers the present value of every future dollar; a higher growth rate raises it. Because those two forces pull in opposite directions, the gap between your growth assumption and your discount rate does much of the work in the result.
The terminal value captures every cash flow beyond the explicit forecast period, usually by assuming cash flows grow at the terminal growth rate forever. For most companies the terminal value is the largest single component of the total, so the terminal growth rate and the discount rate tend to dominate the output far more than the year-by-year forecasts. A small change to either can move the implied value substantially, which is why the model returns a sensitivity table alongside the implied share price. The table shows how the result shifts as those key assumptions move, so you can see the range the model supports rather than fixing on one point.
The model returns an implied share price and the upside or downside versus the current price. Alongside the sensitivity table, the analysis panel can switch to a Valuation History view that plots the company's historical valuation multiples (EV/EBITDA, P/E, EV/Sales, P/B) with today's market point and the DCF-implied forward point.
The DCF gives you detailed control over how it is built:
- Projection: switch between a single flat growth rate and a multi-year schedule with per-year revenue growth, operating margin, tax, D&A, capex, and working-capital assumptions.
- Discount rate: enter WACC directly, or build it up from its components via CAPM (risk-free rate, beta, equity risk premium, cost of debt, weights) or a Fama-French factor model.
- Terminal value: compute it by Gordon perpetual growth or by an exit EV/EBITDA multiple.
- Base data: normalize the starting figures to the last fiscal year or to a 3- or 5-year average, and edit them directly (revenue, net debt, cash, shares outstanding, current price).
Each editable assumption carries a small history icon that opens a mini chart of its past values, with a selector for 5 to 10 years of history to help you anchor your inputs.
Scenarios
Scenarios compare Bull, Base, and Bear cases, or your own, side by side. The point of the framing is that no single set of assumptions is certain, so instead of committing to one forecast you describe a plausible range. The Base case holds your central expectations. The Bull case pairs more optimistic assumptions, such as faster growth or a lower discount rate, and the Bear case pairs more cautious ones. Each case keeps its own assumptions, so you read a spread of valuations and can judge how much the answer depends on the view you take.
Residual Income (RI Model)
Residual income values a company as its current book value plus the present value of the returns it earns above its cost of equity. The idea is that book value already records the equity capital invested in the business, and only the profit earned in excess of what shareholders require to hold that capital adds value beyond it. If a company earns exactly its cost of equity, its worth is its book value; earning more adds value, earning less subtracts it.
This approach is useful where a cash-flow model is awkward to apply. It suits banks and other financial companies, whose value ties closely to book equity, and firms with negative or volatile free cash flow, where discounting cash flows directly gives an unstable result. It anchors the estimate on the balance sheet and reported returns rather than on long-range cash projections.
Comparables
A comparables-based valuation is planned and marked as coming soon. It will value a company by applying relative multiples drawn from its peers, so you can judge the price against how the market values similar businesses rather than on an intrinsic estimate alone.
What you can do
- Edit the assumptions for each model and see the results update live.
- Compare scenarios against one another.
- Export the DCF, including its assumptions and results, to PNG, PDF, or Excel.
Your assumptions drive the output
Each model's output depends entirely on the inputs you enter. Small changes to growth or the discount rate can move the implied value by a large amount, so read the result as one estimate under one set of assumptions, not a fixed price target.