Chart
The Chart view is an interactive price chart with technical indicators and flexible time controls.
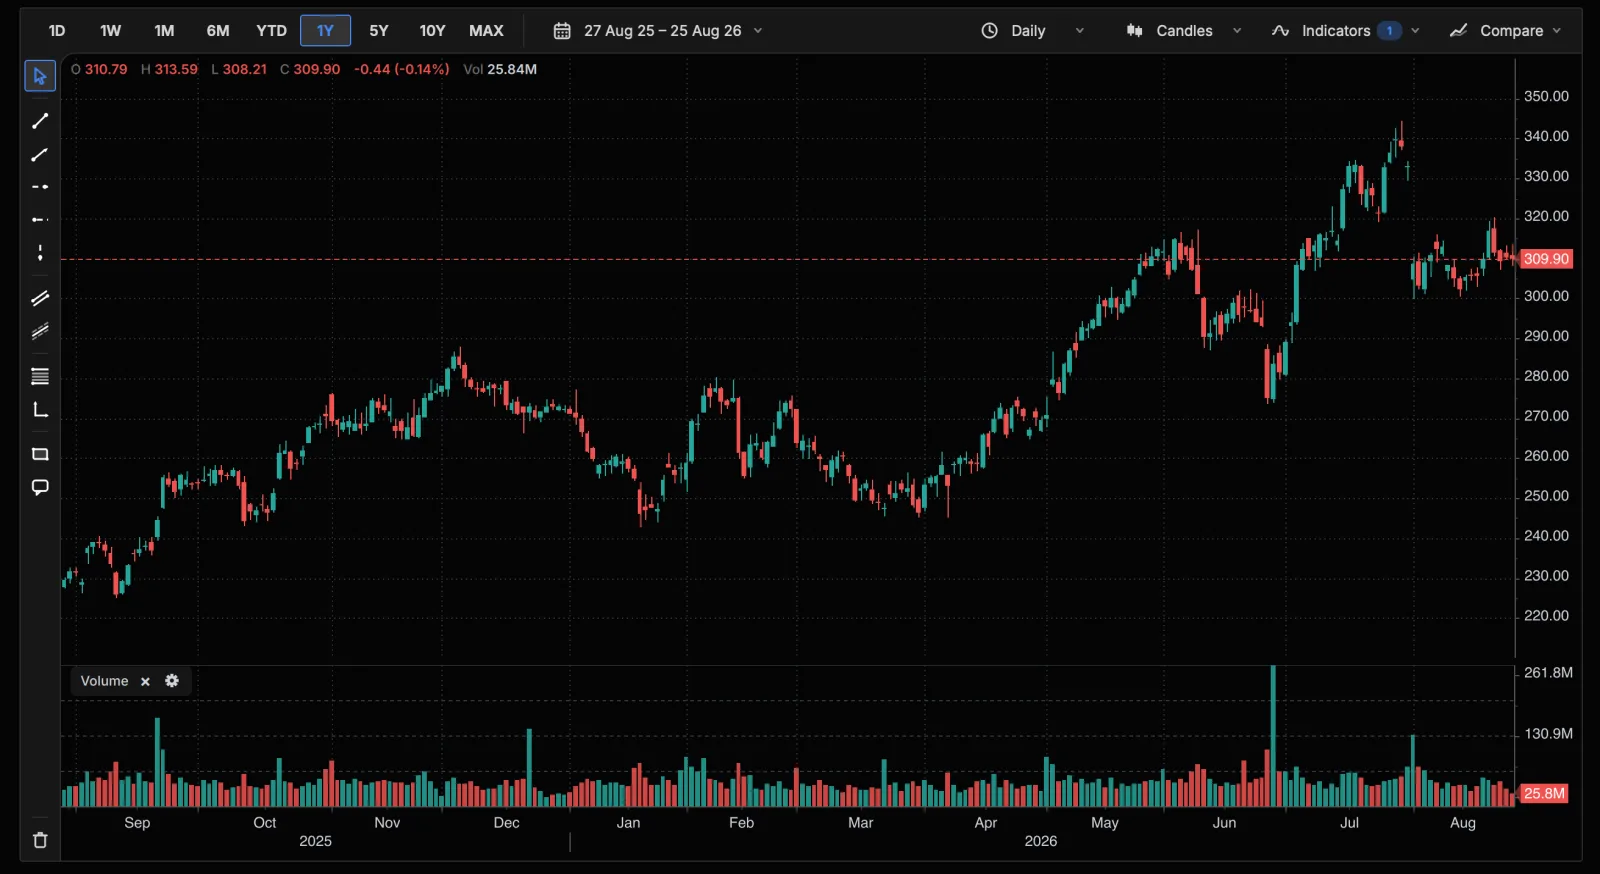
What you'll see
- A price chart (candlestick or line) of historical prices.
- A volume panel beneath it, which you can toggle on or off.
- Optional additional indicator panels.
- A hover tooltip showing date, open/high/low/close, and volume.
What you can do
- Time period: quick buttons for 1D, 1W, 1M, 6M, YTD, 1Y, 5Y, 10Y, and MAX, or enter a custom date range.
- Chart type: choose from line, area, candlestick, OHLC, Heikin-Ashi, baseline, and hollow candles.
- Volume: show or hide the volume panel.
- Indicators: add and configure overlays (moving averages, Bollinger Bands, Donchian and Keltner channels, MA envelopes, VWAP, Parabolic SAR) and panel oscillators (RSI, MACD, PPO, Stochastic, CCI, Williams %R, Rate of Change, MFI, and more), plus preset sets such as Golden Cross and MA Ribbon.
- Add comparison: overlay one or more other companies on the same chart.
- Interval: choose the tick interval when intraday data is available.
Chart type
- Candlestick: each bar covers one interval and shows four prices at once. The thin wick marks the high and low, while the thick body spans the open and close. The body direction shows whether the interval closed above or below its open, so candlesticks convey the range and the direction of each period.
- Line: connects the closing price of each interval into a single path. It drops the intraday range in favor of a clean read of the closing trend, which suits long horizons where individual candles would be too dense to see.
Comparison overlay
Adding a second company rebases both series so their movement is measured from a common starting point over the selected period. This turns the chart into a relative performance read: you see which company gained more and how the gap widened or closed across the window, rather than comparing raw prices that sit at different levels.
Indicators
Indicators fall into two groups. Overlays draw on the price panel itself, while oscillators draw in their own panel below the price.
Moving averages (SMA/EMA)
A moving average smooths price into a single trend line by averaging recent closes.
- SMA (simple moving average): the plain average of the last N closes, giving every period equal weight. It is smooth and steady but slower to turn after price changes direction.
- EMA (exponential moving average): a weighted average that puts more weight on recent closes, so it tracks price more closely and reacts sooner than an SMA of the same length. Analysts read the slope for trend direction and watch crossings between a shorter and a longer average, or price crossing the average, as shifts in momentum. A shorter length hugs price and turns often; a longer length is smoother and slower.
Bollinger Bands
Bollinger Bands wrap a moving average in two bands set a number of standard deviations above and below it. Because the bands are built from standard deviation, they widen when price becomes more volatile and contract when it settles. Price tends to spend most of its time between the bands, so touches of the upper or lower band mark stretched moves relative to the recent average, and a tight band signals a quiet stretch of low volatility.
MACD
MACD (moving average convergence divergence) is the difference between a shorter and a longer EMA of price, plotted as the MACD line. A signal line, itself an EMA of the MACD line, is drawn on top, and the gap between the two is shown as a histogram. Crossings of the MACD line and the signal line, and the MACD line crossing zero, are read as momentum turning. The histogram shows that gap widening or narrowing, which hints at momentum building or fading before a crossing.
RSI
RSI (relative strength index) is a momentum oscillator bounded between 0 and 100 that compares the size of recent gains to recent losses. Readings above 70 are the conventional overbought level and readings below 30 the oversold level, marking moves that have run far in one direction. Analysts also watch the 50 line for trend bias and look for divergence, where price makes a new extreme that RSI does not confirm.
Stochastic
The Stochastic oscillator measures where the current close sits within its high-to-low range over a lookback window, scaled from 0 to 100. A reading near 100 means price closed near the top of its recent range and near 0 means it closed near the bottom. It plots a fast line and a smoothed signal line, with readings above 80 treated as overbought and below 20 as oversold. Crossings of the two lines inside those zones are the common signal.
Your settings are remembered
Your last-used period, chart type, and volume setting persist across sessions. Switching companies updates the chart in place; indicators and comparisons reset when you change ticker.