Analytics
The Analytics view tracks how a company's ratios change over time and breaks down its returns.
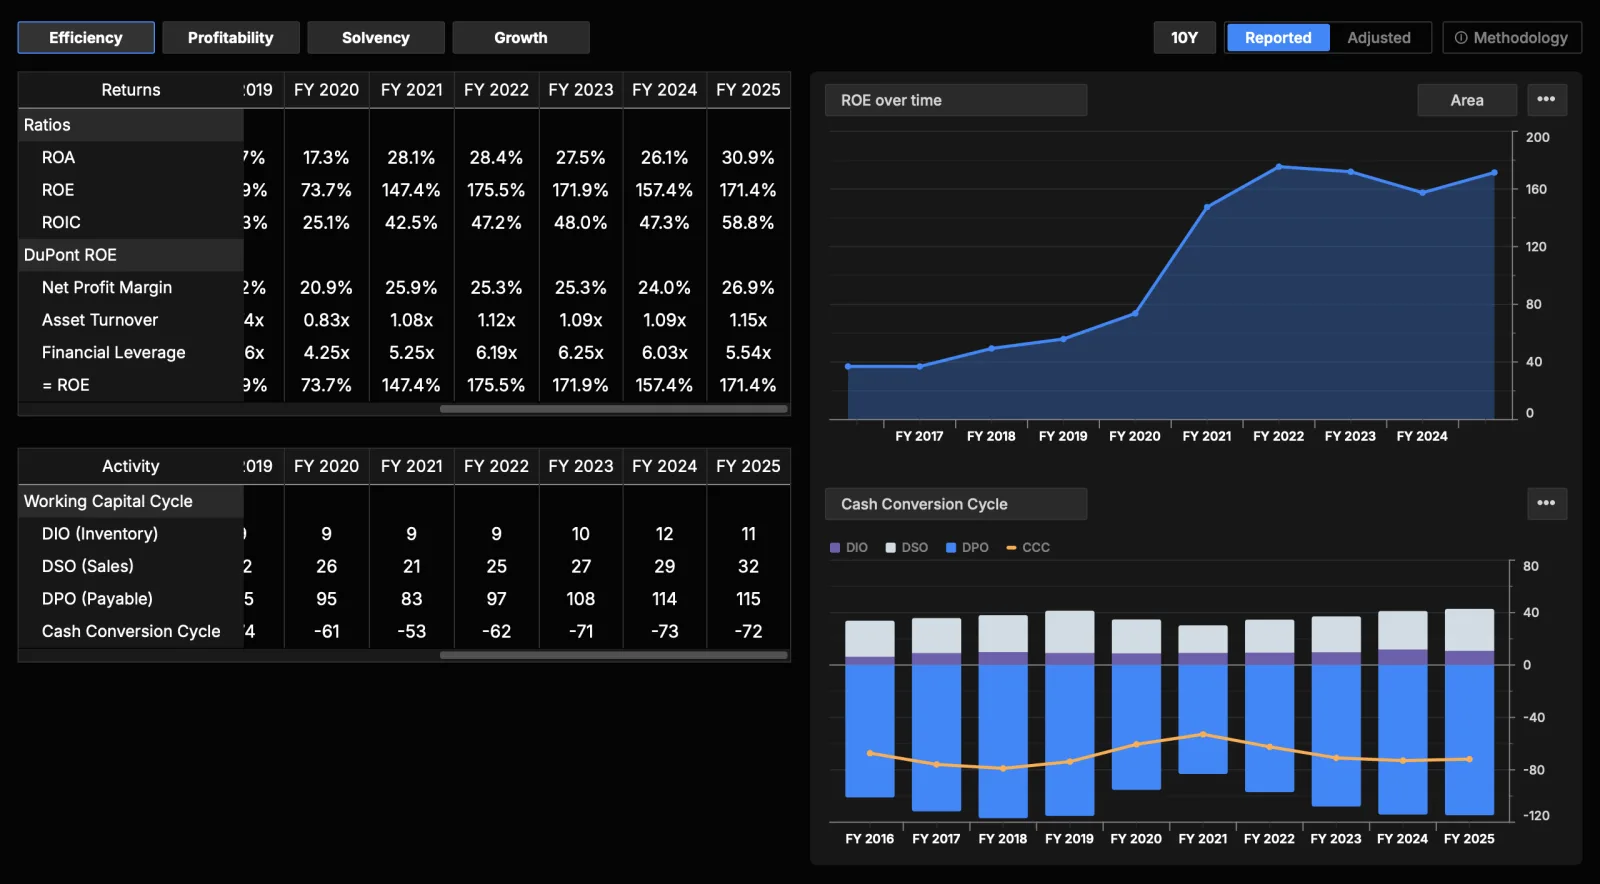
What you'll see
- Category buttons: switch between Efficiency, Profitability, Solvency, and Growth.
- A trend table showing the selected category's ratios across recent years.
- Charts: a trend chart for individual ratios, plus a DuPont breakdown that decomposes return on equity into its drivers, such as margin, asset turnover, and leverage.
What you can do
- Click a category to change which ratios are shown.
- Expand the number of years displayed to see longer-term trends.
- Hover over the charts for exact values.
- Switch between Reported and Adjusted basis. Adjusted shows an alternative, analyst-oriented presentation of the ratios.
Reading the categories
The four category buttons group ratios by the question they answer.
- Profitability: how much of each dollar of sales or capital the company keeps as profit. This is where gross, operating, and net margin sit, alongside returns on capital. A rising trend means the company is converting revenue into earnings more effectively, whether through pricing power, cost control, or a better mix of products. A falling trend points to margin pressure, rising input costs, or heavier spending that has not yet paid off.
- Efficiency: how hard the company works its assets and capital to generate sales. Asset turnover and related activity measures live here. A rising trend means the company produces more revenue per dollar of assets, a sign of tighter operations or fuller capacity use. A falling trend can signal overinvestment, idle capacity, or slowing demand against a growing asset base.
- Solvency: whether the company can carry and service its obligations. This covers leverage and coverage measures. Read solvency together with profitability: rising leverage lifts return on equity while conditions are good, but it also raises the fixed burden the company must cover if earnings fall.
- Growth: how fast the business is growing and whether it can pay for that growth itself. Revenue, EBIT, EPS, and free cash flow are shown year over year, each with a trailing CAGR. A second table holds the growth engine, an identity rather than a forecast: the reinvestment rate multiplied by ROIC gives the growth the company can self-fund, and the gap between that and delivered revenue growth is the growth bought with outside capital. A company growing well ahead of what it funds itself is relying on capital markets to keep going.
Because the trend table lines up several years side by side, the direction and consistency of a ratio often matter more than any single year. A steady figure that holds through a downturn tells you something a one-year snapshot cannot.
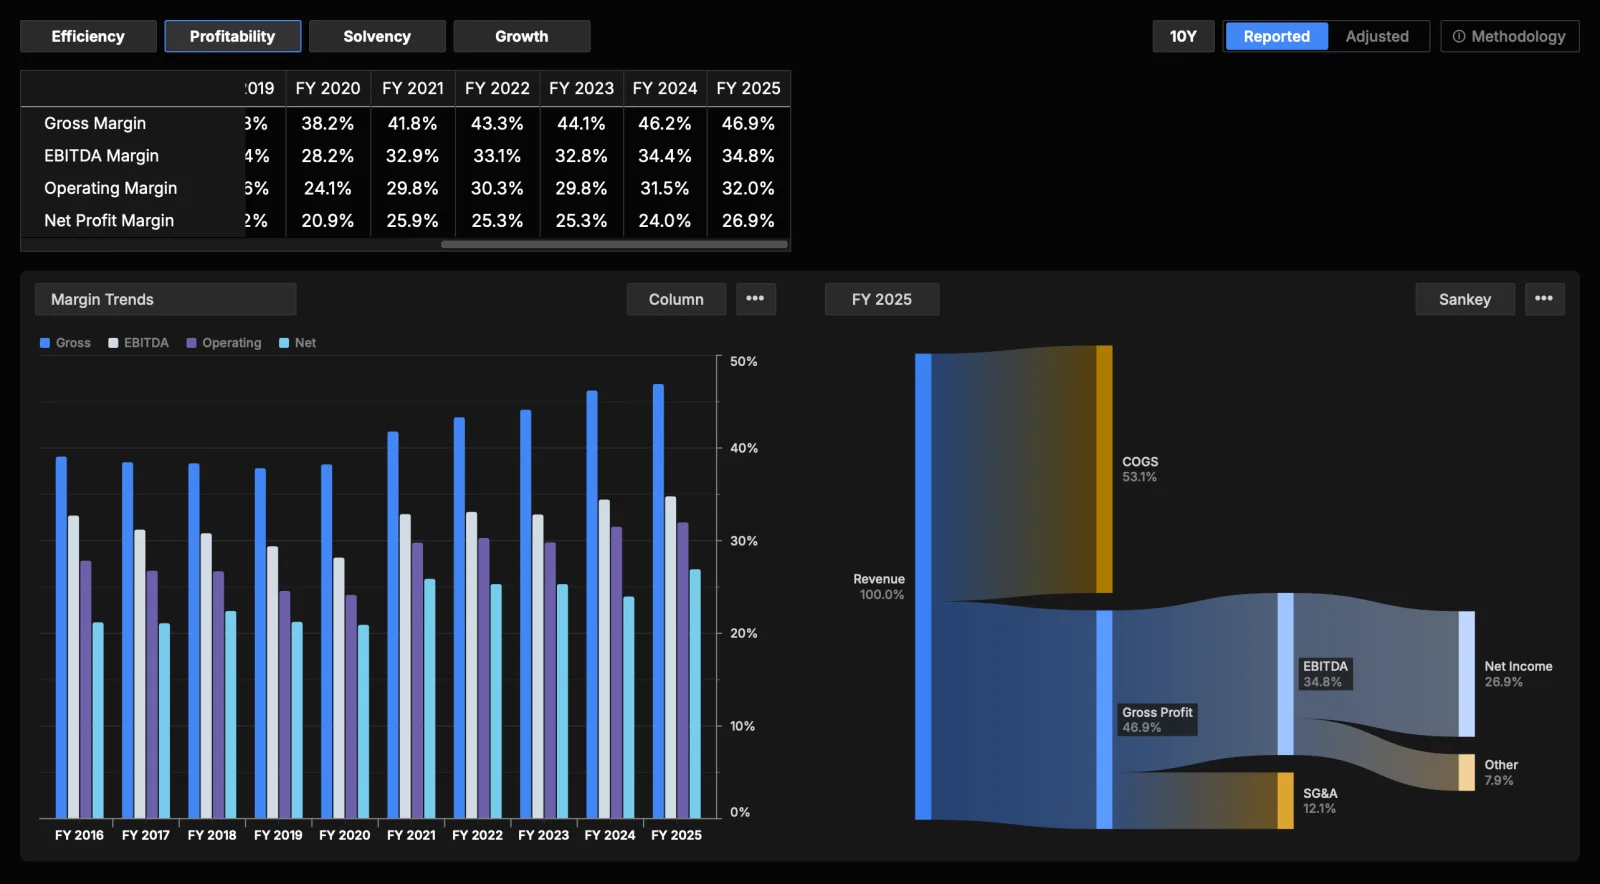
Management commentary
The Growth category adds a commentary band beneath the tables, summarizing what management itself said about the period. Current Year Discussion covers the results just reported — what moved revenue, margins, costs, and tax. Forward Outlook covers what management expects next, including liquidity, commitments, and capital returns. Use View more to read the full text.

AI-assisted
The commentary is summarized with AI from the management discussion and analysis section of the company's filings. Confirm important details against the filing itself.
The DuPont breakdown
DuPont analysis explains why return on equity is what it is by splitting it into drivers you can read separately. Two companies can post the same ROE for very different reasons, and the decomposition makes that visible.
Three-step form
The standard decomposition breaks ROE into three multipliers:
ROE = net margin x asset turnover x financial leverage
where each driver is:
- Net margin = net income / revenue. The profitability lever. It answers how much profit survives from each dollar of sales after all costs, interest, and tax.
- Asset turnover = revenue / total assets. The efficiency lever. It answers how much revenue the company generates from its asset base.
- Financial leverage = total assets / shareholders' equity. The capital structure lever, also called the equity multiplier. It answers how much of the asset base is funded by sources other than equity. A larger multiplier lifts ROE but also raises risk.
Multiplying the three reconciles exactly to ROE, because revenue and total assets cancel across the terms. The value of the split is diagnostic: a high ROE built on thin margins and heavy leverage is a different business from one built on fat margins and low debt, even at the same headline number.
Adjusted-basis form
On the Adjusted basis, the decomposition switches to the Penman reformulation, which separates operating performance from financing:
ROE = RNOA x NOPAT margin x net financial leverage
where the terms are:
- RNOA (return on net operating assets): the return the core business earns on the capital actually invested in operations, before financing.
- NOPAT margin: net operating profit after tax as a share of revenue — the operating profitability lever, stripped of financing effects.
- Net financial leverage: how much net debt amplifies the operating return into the return on equity.
This form is useful when you want to separate how well the operating business performs from how much its financing structure is adding to (or subtracting from) the return to shareholders.
How to read the drivers together
- Rising ROE driven by margin or turnover usually reflects a stronger underlying business.
- Rising ROE driven mainly by leverage is a financing choice, not an operating improvement, and it raises the downside if earnings weaken.
- Falling margin offset by rising leverage can leave ROE flat while the business is quietly getting riskier. The decomposition is what surfaces that.
Tip
Use the DuPont breakdown to understand why a company's return on equity is high or low, rather than reading the headline number on its own. Watch which driver is moving: a company propping up ROE with leverage rather than margin or turnover carries more risk than the single number suggests.